Acknowledge active alerts
New alerts are handled as active alerts until they are acknowledged. To stop alert escalation, you acknowledge active alerts.
When an SMC component generates an alert, it sends the alert to the Log Server. The Log Server stores the alert entry. A new alert entry is handled as an active alert by the Management Server. A Domain’s active alerts are visible when you are logged on to the Domain. Active alerts are stored on the Management Server until the alerts are acknowledged. In an environment with multiple Management Servers, active alerts are automatically replicated between the Management Servers.
Alert entries are displayed in the Active Alerts view and in the Logs view with other types of log entries. You can also view alert entries in the Web Portal.
You can acknowledge alert entries in the Active Alerts view. When an alert entry is acknowledged, it is removed from the Active Alerts view and from the Management Server. An audit entry is created when an alert is acknowledged. All Alert Chain processing for that alert entry is stopped. You can acknowledge alerts one by one. You can alternatively aggregate similar types of alerts as a group and acknowledge the whole group of alerts at the same time.
![]() For more details about the product and how to configure features, click Help or press F1.
For more details about the product and how to configure features, click Help or press F1.
Steps
-
Click
 Active
Alerts in the bottom right corner of the Management Client.
By default, the Active Alerts view opens with all active alerts aggregated by Situation.
Active
Alerts in the bottom right corner of the Management Client.
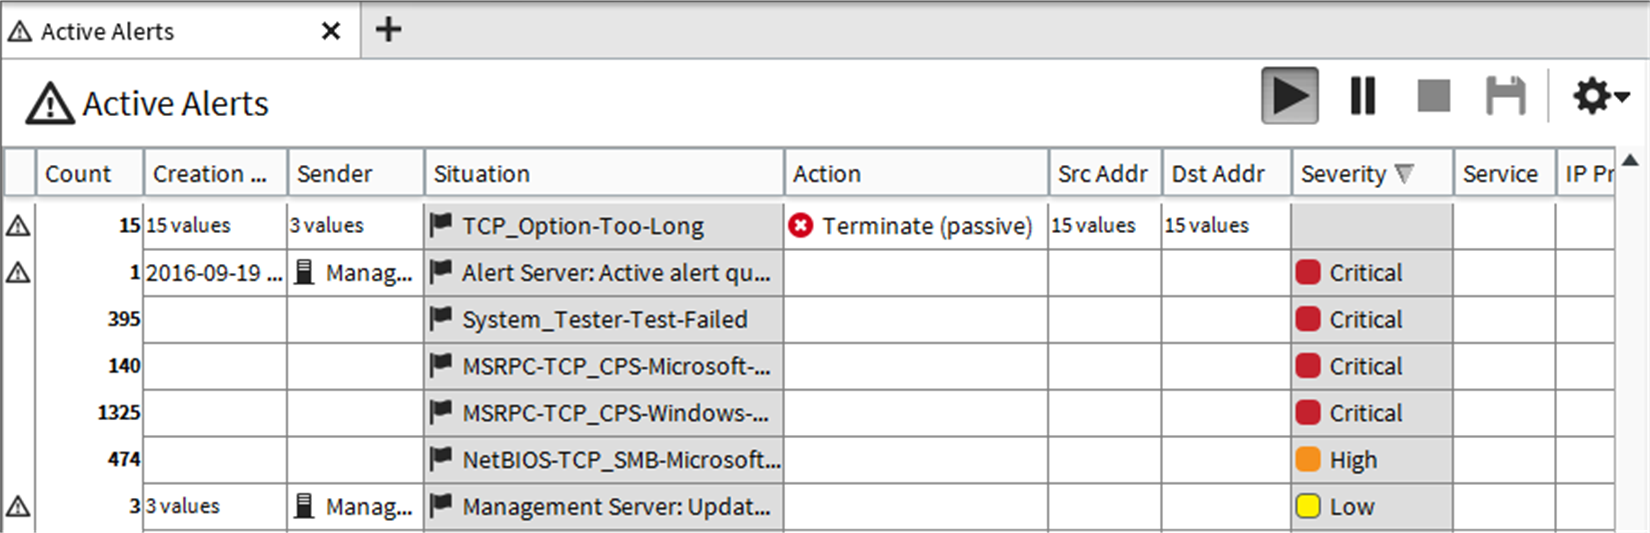
By default, the Active Alerts view opens with all active alerts aggregated by Situation.Figure: Active Alerts view
-
Select one or more alert entries.
- To aggregate the alert entries by time or sender, select
 Tools > Aggregate > Sort by Time or Tools > Aggregate > Aggregate by Sender.
 - To view the individual alerts, select Tools > Details.
- The Query pane allows you to filter the active alert entries so that you can find the information you need.
- To aggregate the alert entries by time or sender, select
Active Alerts view
Use this view to investigate and acknowledge alerts.
| Option | Definition |
|---|---|
| Toolbar | |
| Stop | Aborts the running query. |
| Columns |
|
| Aggregate |
|
| Details | Displays the individual alerts. |
| Alerts | Opens the Alert tab. |
| Log entry table | Several menu options are available when you select an entry and right-click:
|
| Option | Definition |
|---|---|
| Query pane | |
| Query drop-down list | Select a Log Data Context. To select a Log Data Context that is not in the list, select Select. To create a Log Data Context, select New. |
| Filter tab | |
| New |
|
| Save | Opens the Filter Properties dialog box that allows you to save the current filtering criteria as a permanent Filter element. |
| Snapshots tab |
Allows you to compare snapshots of entries. The names of the snapshots selected for comparison are shown in two separate fields.
Current compares the current entries with a previously saved snapshot. Current is only available if the view is in the Current Events mode. If you click Pause in the toolbar a temporary snapshot of the current entries is selected as the first snapshot for comparison. |
| Select | Opens the Select Element dialog box, where you can select a previously saved snapshot as the first snapshot for comparison. |
| Compare with | Select to compare snapshots. |
| Second field | Shows the second snapshot selected for comparison. |
| Select | Opens the Select Element dialog box, where you can select a previously saved snapshot as the second snapshot for comparison. |
| Time limit drop-down list |
|
| Open Calendar | Select the dates from where you want to query data. |
| Apply | Retains and applies your changes. |
| Option | Definition |
|---|---|
| Fields pane | |
| Category drop-down list |
|
| Field | The name of the field. |
| Value | The value in the field. |