How reports are constructed
Reports are summaries of log data and statistical monitoring information. Reports consist of Report Items, Report Sections, and Report Designs.
The following illustration shows their relationships.
Figure: Reporting objects and elements
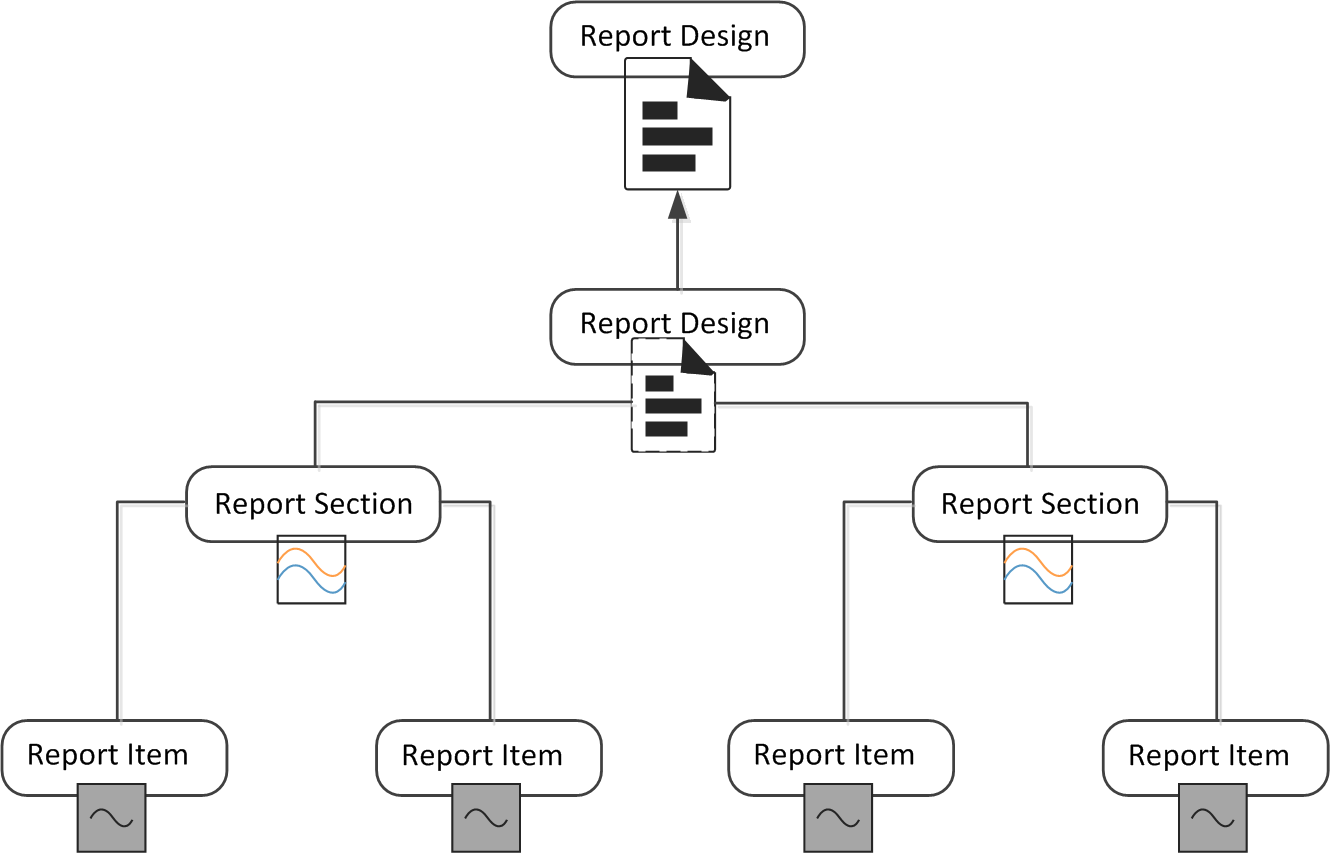
The Report Design is the main container for a particular type of report. The Report Designs are used as the basis for Report Tasks that generate the reports that you can view.
The Report Design consists of one or more Report Sections. A Report Section defines parameters for all items within it. It mainly defines how the information is displayed, such as the type of chart and the number of top items shown. Each Report Section in the Report Design creates a separate chart and table in the generated report.
Each Report Section contains one or more Report Items. Each Report Item represents a way to summarize the data. For example, a Report Item might summarize the total number of connections counted between the start and end times defined for the task that generates the report.
Each item adds specific information to the chart or table that the Report Section generates. For example, the items, total traffic volume, sent traffic volume, and received traffic volume, are shown as separate lines on the curve chart that the Report Section generates.