What Overview elements show
Overviews contain high-level status and statistical information.
You can use overviews to view:
- The system status
- Bookmarks, such as logs filtered with specific criteria
- Statistical charts on system operation (such as engine load) and the traffic flow
Figure: Example overview
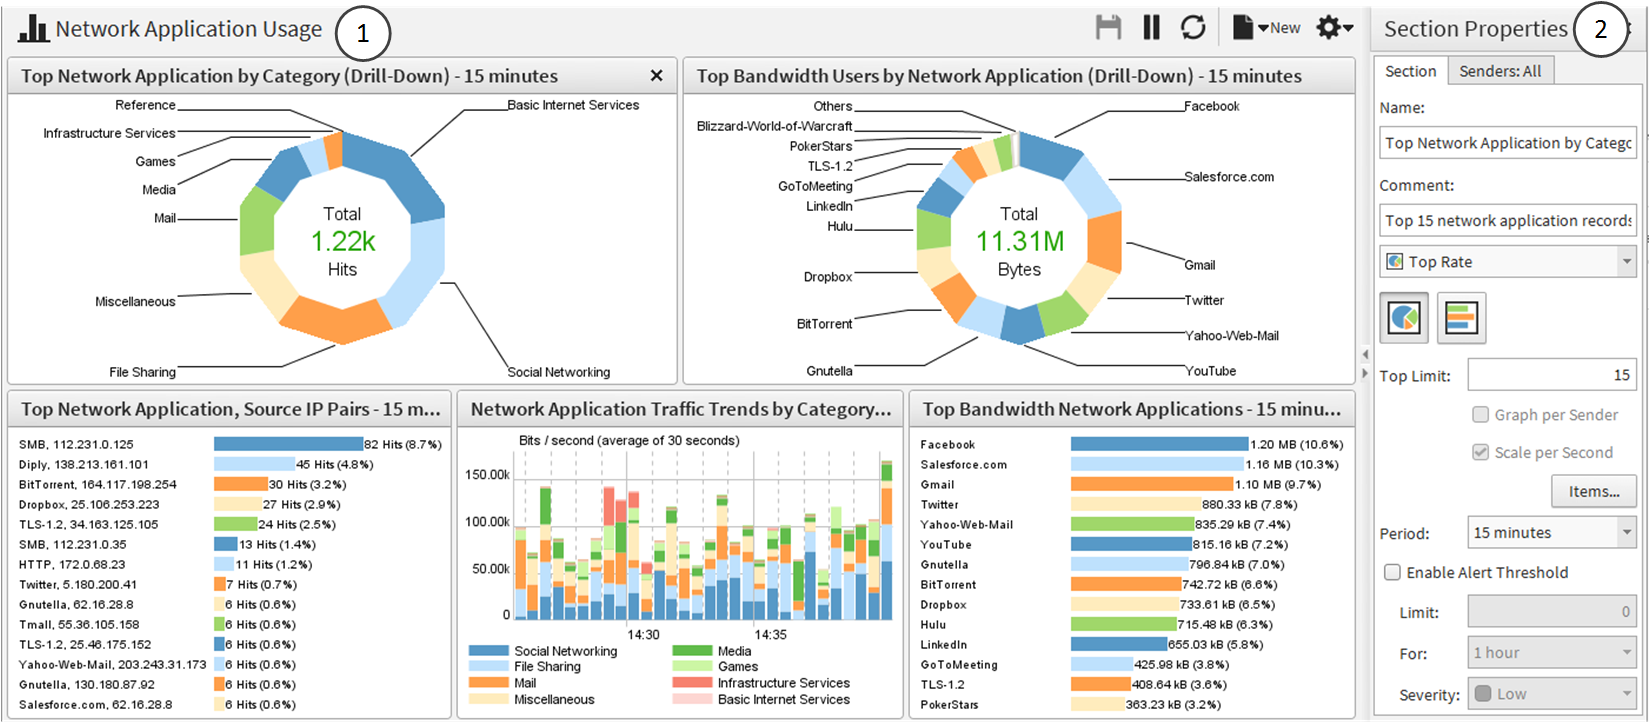
- 1
- Information is displayed as resizeable sections.
- 2
- Use this pane to conveniently edit the content and appearance of the selected section.
You can create several different overviews for different purposes. Several default overviews are provided as templates.
In addition to status information, you can add various statistics related to the traffic and the operating state of components. You can display information in various ways, such as tables, maps, and different types of charts. Statistics can trigger an alert when the value of a monitored item reaches a limit you set.