Statistics arrangement of the Logs view
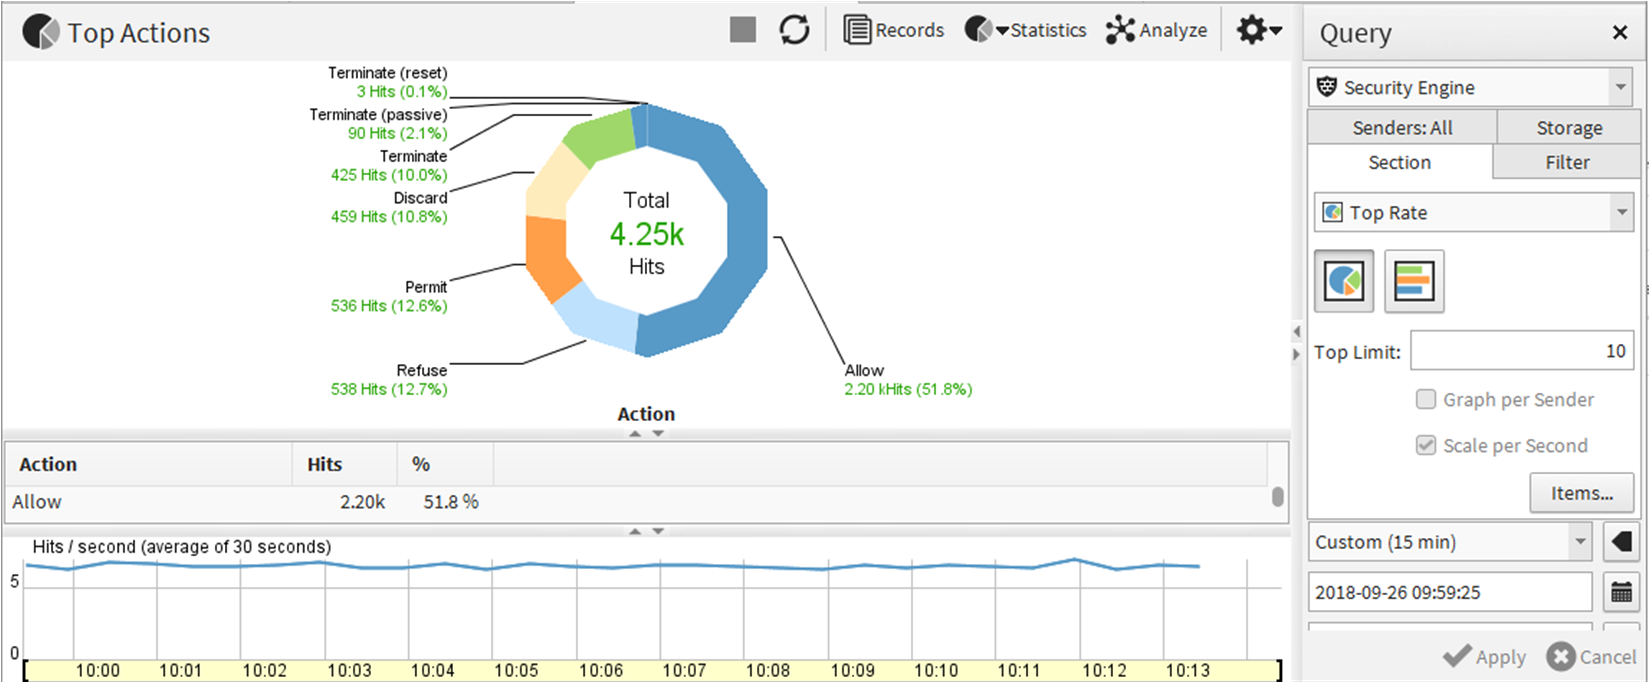
In the Statistics arrangement of the Logs view, you can view charts of multiple events interactively. You can create a quick report of the log entries that match the active Query. You can then further refine the Query by viewing log entries that correspond to a chart segment.
Figure: Statistics arrangement
Tip: Right-click the chart sections for options that allow you to drill-down into the details.
The Query pane in the Statistics arrangement includes another Section tab. You can use the tabs to control the statistical display. The data can also be filtered in the same way as in other arrangements.
Figure: Toolbar in the Statistics arrangement
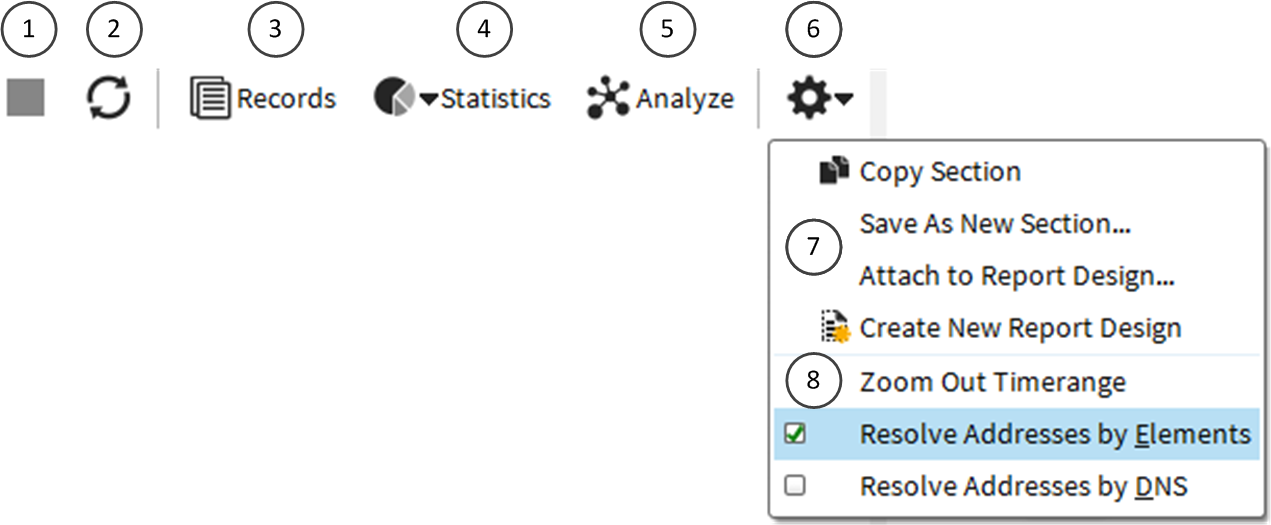
- 1
- Stop the ongoing operation
- 2
- Refresh
- 3
- Show the Records arrangement
- 4
- View graphical summaries based on the log entries
- 5
- Opens the Log Analysis view
- 6
- Opens the Tools menu
- 7
- Options for creating new sections and reports
- 8
- Generate a new chart with a wider time range
The chart area in the Statistics arrangement can contain a pie chart, a bar chart, a line chart, stacked line chart, or a map chart (based on an internal geolocation database). The available options depend on the chart type that is selected:
- Top rate charts can be displayed as a pie chart, bar chart, or a map. A top rate chart shows the total numbers of records that match the query.
- Progress charts can be displayed as a line chart, stacked line chart, bar chart, or stacked bar chart. A progress chart illustrates the numbers of records plotted over time (similar to the timeline, but in more detail).
When a chart is generated, you can right-click for a menu of actions related to the section and possibly the element that the section corresponds to. The actions available vary by section. Some of the most important actions are listed as follows:
- Show Records — Opens the Records arrangement filtered to show the entries that comprise the chart section you right-clicked.
- Add to Current Filter — Allows you to use sections to filter data by adding the section in question to the Filter tab of the Query pane.
- Statistics item shortcuts — Drill down to create a chart from data that matches the previous chart section.