How the Logs view is arranged
The default records arrangement is optimized for efficient browsing of many entries.
Figure: Logs view in the records arrangement
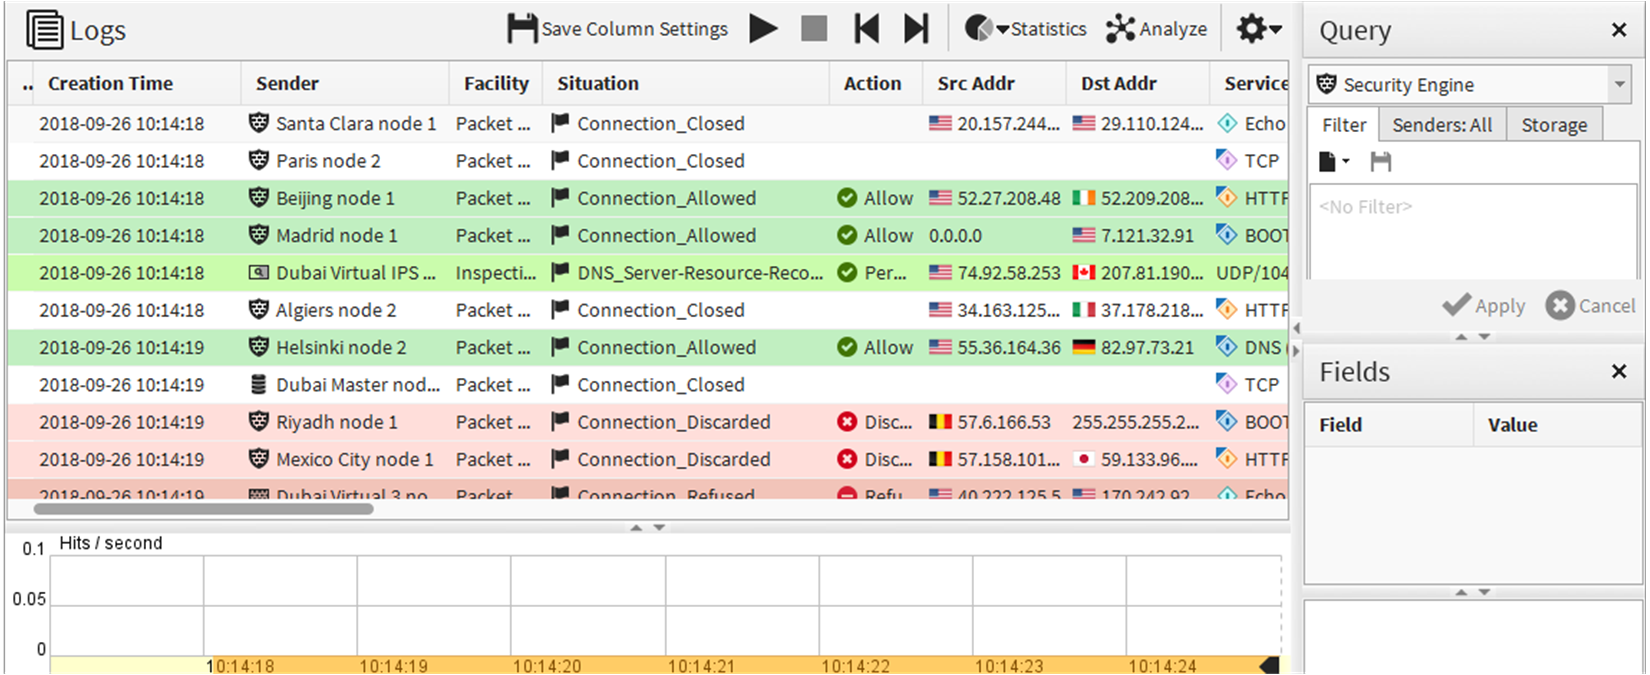
Figure: Toolbar in the records arrangement
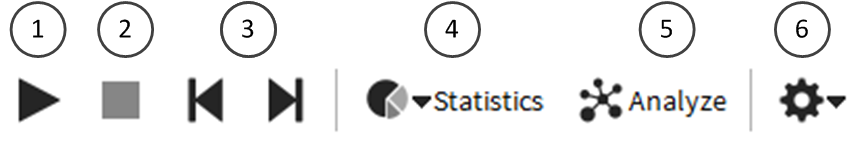
- 1
- Current events mode
- 2
- Stop the ongoing operation
- 3
- Go to the first or last record
- 4
- View graphical summaries based on the log entries
- 5
- Opens the Log Analysis view
- 6
- Opens the Tools menu
Figure: Status bar options for log browsing

- 1
- Activity status
- 2
- Server connectivity status
- 3
- Set the time zone
- 4
- The logged in user
- 5
- The location — defines the Log Server contact address if there is NAT between the Management Client and a Log Server
Note: If NAT is applied between your Management Client and a Log Server, you must select the correct Location for your Management Client to see the logs.
Logs view panes
You can select and deselect panes from ![]() Menu > View > Panels.
Menu > View > Panels.
The following panes are available in most arrangements:
- Fields pane — Provides quick access to categorized log entry details.
- Query pane — The most important tool in the Logs view. The Query pane allows you to filter the log entries so that you can find the information you need.
- Task Status pane — Only available in the records arrangement. Displays the status of log-related tasks, such as a log export that you start from the Logs view.
- Hex pane — Displays traffic recordings generated by the Excerpt logging option of an Inspection rule (other recordings are viewed using an external viewer).
- Summary pane — Textual explanation of the event that generated the record.
- Event Visualization pane — A graphic showing important information about the event.
- Info pane — Displays detailed information on a selected log entry.
Log entry table (records arrangement)
The log entry table in the default records arrangement is the primary view for the log entries. You can freely select which details are shown and the order of the columns. Different types of entries contain different types of information, so none of the entries use all columns.
When you right-click a cell in a log entry, the menu that opens allows you to select various actions related to the log entry. The actions vary slightly depending on the information in the cell. For example, right-clicking an element adds general element-specific actions (such as viewing the properties of the element). The actions include, but are not limited to, the following:
- Details — Switch to the Details view of the selected record.
- Copy — Copy the entry details to the clipboard.
- View Rule — View the rule that generated the log entry (if applicable).
- Create Rule — Create a rule based on the entry.
- Whois — Look up the selected IP address in the online Whois database.
- Export — Export records or attach records to an Incident case.
- Filter Connections — Add basic details from the current selection to the Query pane.
- Show Connection — Add basic details from the selected connection to the Query pane.
- Search Related Events — Some special events are parts of a larger chain of events. This option shows other events related to the selected log entry.
- New Blacklist Entry — Blacklist connections that match the entry’s details.
- Add Filter — Add the selected detail to the filter in the Query pane.
- New Filter — Create a filter based on the selected detail.