Log Analysis arrangement of the Logs view
The Log Analysis arrangement provides various tools to analyze logs, alerts, and audit entries.
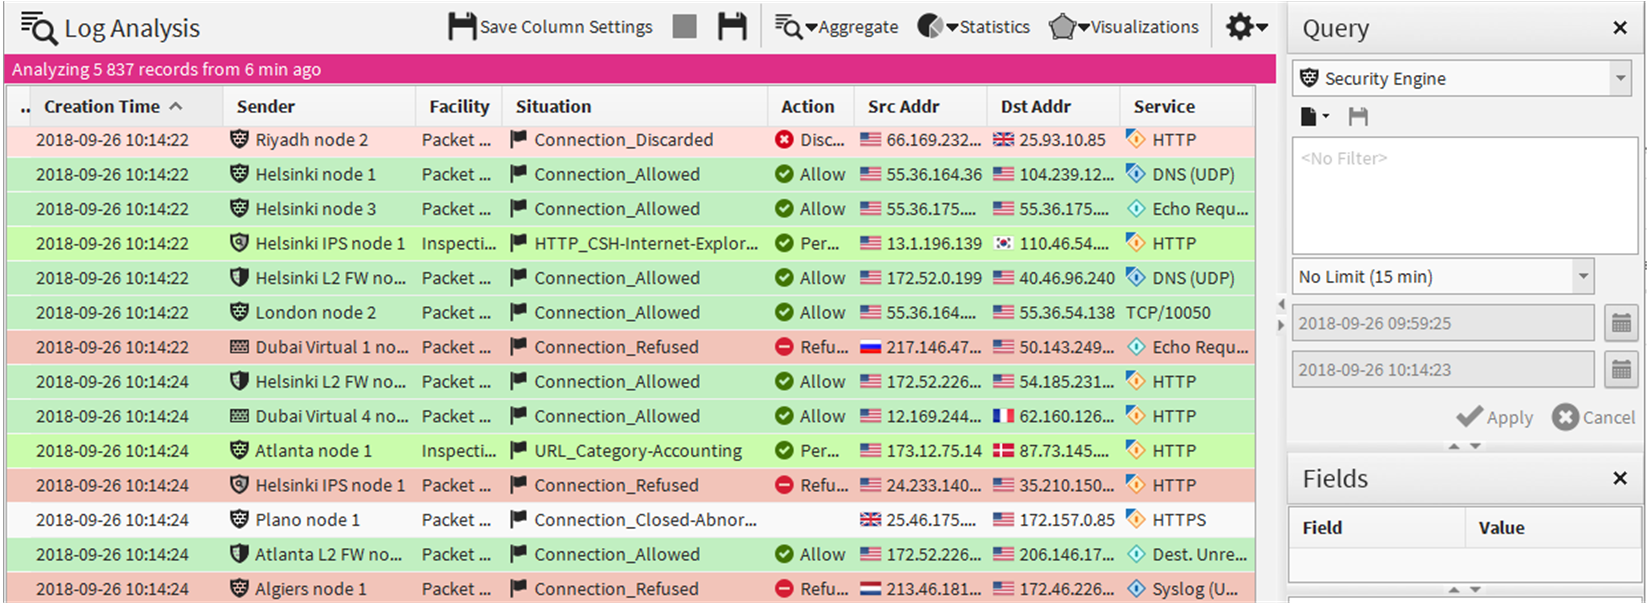
Figure: Log Analysis arrangement
- To combine logs by Service or Situation, select or .
- To sort logs by column type, select , then click the heading of the corresponding column.
- To view the data as charts, click Statistics, then select one of the predefined statistical items. Select Select to select an item from a complete list of statistical items.
- To view the data as a diagram, click Visualizations, then select one of the visualization options.
Table 1. Visualization options Option Explanation Attack Analysis Displays information on Situations of the type Attack or Successful Attack. Indicates allowed and disallowed connections between users and applications. Audit Map Displays information on how users manipulate elements. Application and Executable Usage Displays users and the applications that they use or access. Indicates allowed and disallowed connections between users and applications. Service Map Displays access to services in the network.
You can zoom in on the data presented in the visualization diagrams with the mouse wheel. Right-clicking elements in the diagrams opens a pop-up menu with various options to further analyze the elements and add them to filters. You can also, for example, drag and drop objects from the visualization diagram to the Query pane to create a filter.