What the Logs view shows
The Logs view can show entries generated by any SMC components and third-party components that send data to the SMC.
The logged data includes alert and audit entries (depending on administrator rights). You can filter the display by any combination of details that exist in the records. There are four different arrangements: Records, Statistics, Details, and Log Analysis.
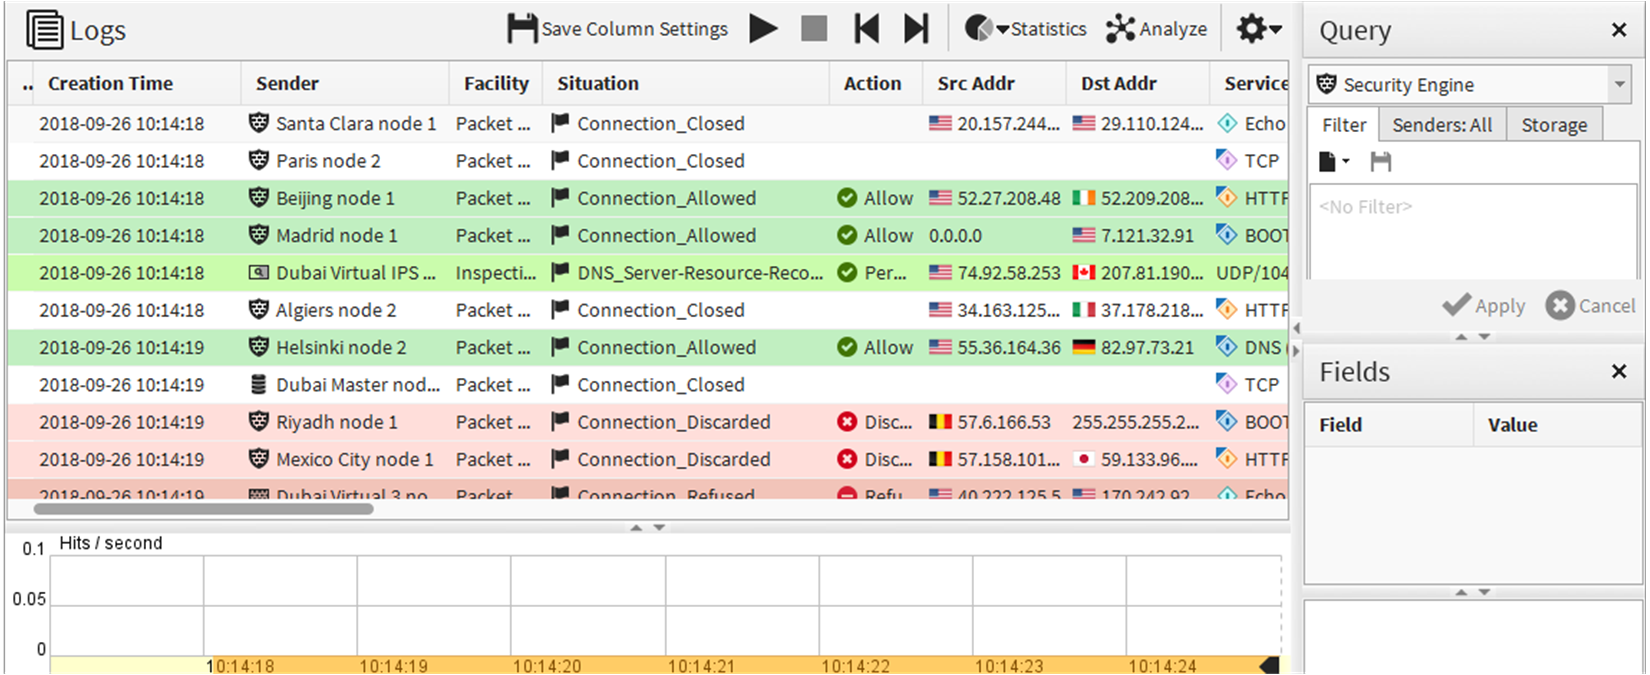
Records arrangement
The Records arrangement allows you to view selected details of many entries at a time. The columns in the table are fully customizable. This default view arrangement displays logs as a table. The Query pane allows you to select data to display.
Figure: The Logs view in the Records arrangement
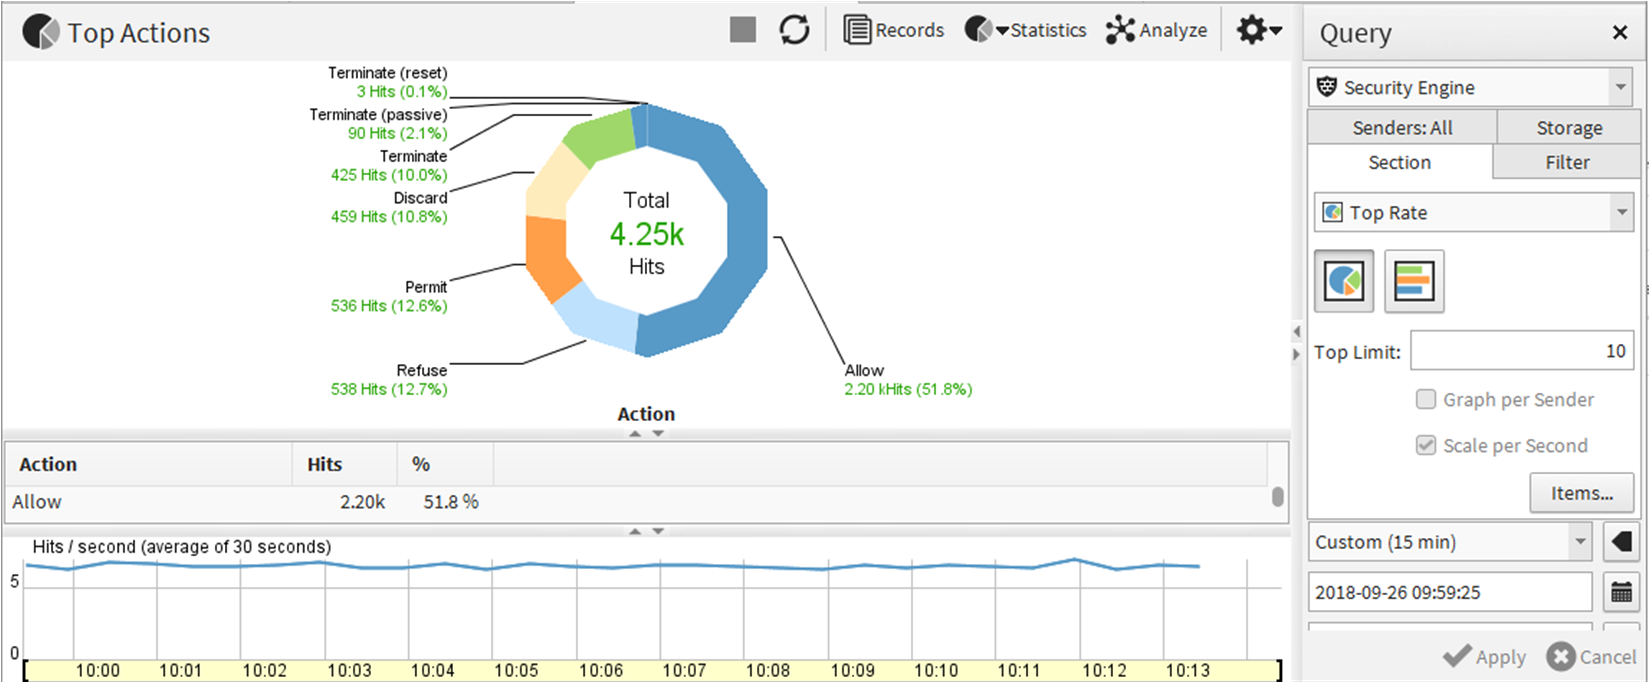
Statistics arrangement
The Statistics arrangement allows you to generate basic summaries of the log data currently displayed in the Logs view. The basic summaries are similar to the charts in overviews, and include the ability to drill into the logs through individual chart items.
Figure: Statistics arrangement
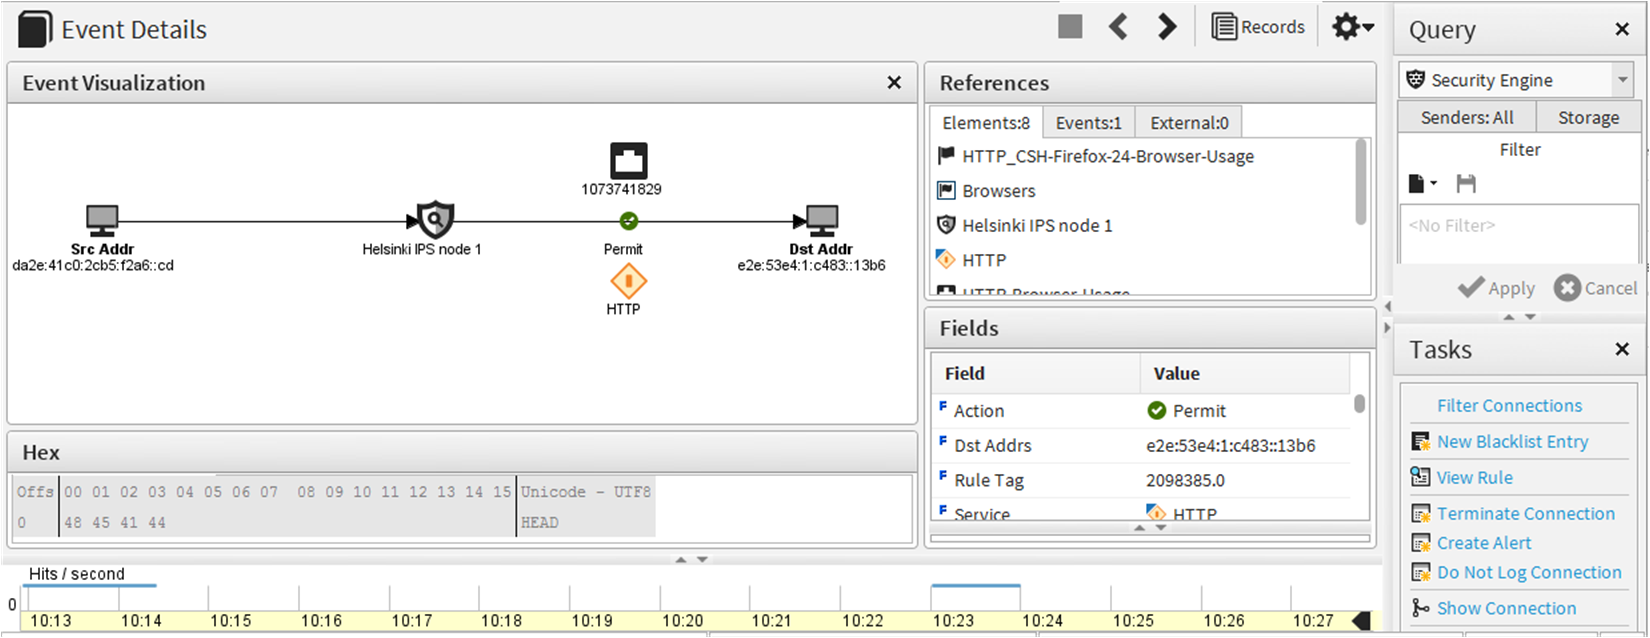
Details arrangement
The Details arrangement gives an overview of an individual log entry.
Figure: Details arrangement
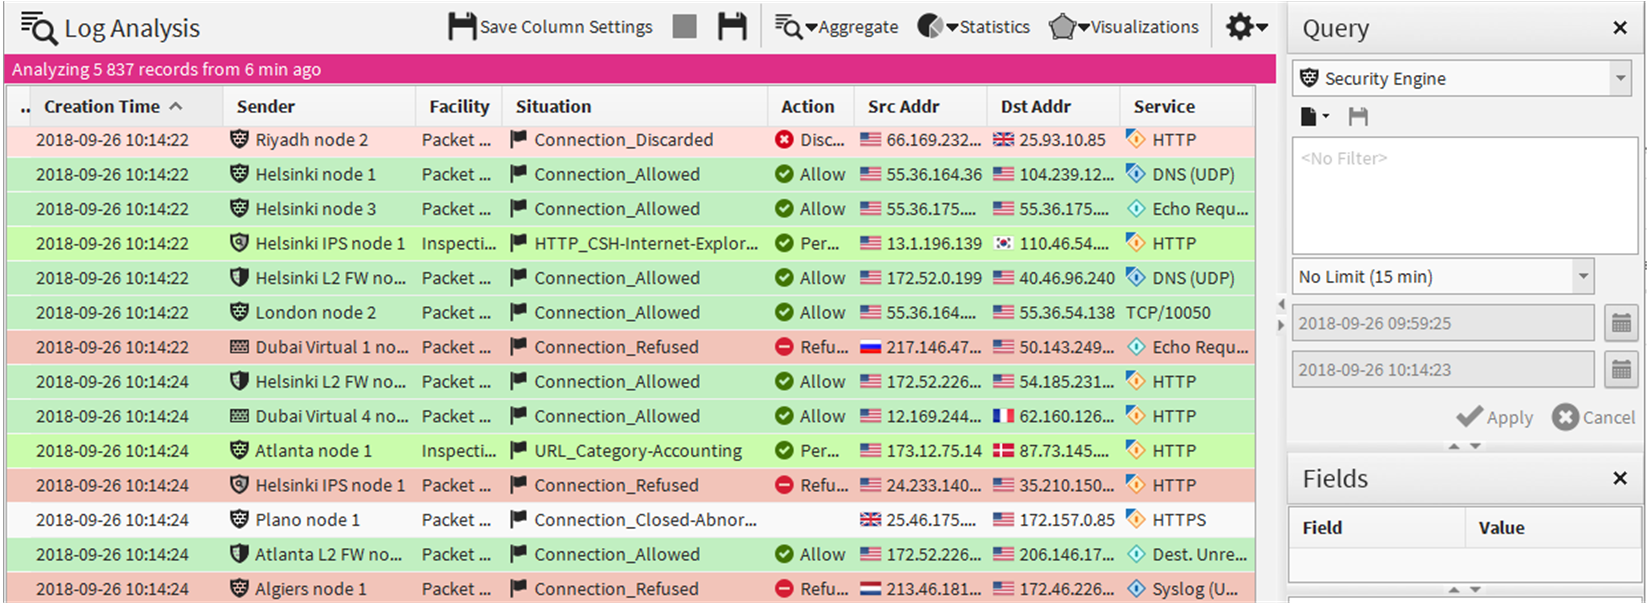
Log Analysis arrangement
The Log Analysis arrangement provides various tools to analyze and visualize log data. For example, you can combine logs by service or situation, sort logs by column type, view the data as charts or diagrams. The various tools make it easier to notice patterns and anomalies in traffic.
Figure: Log Analysis arrangement